Orient
Start with the whole basin.
Spin from the global view into Colorado, then hold geographic context while the model narrows toward the DJ Basin.
124,302 wells indexedOil AI gives indexed Colorado and Texas wells and supported grid cells a historical screening score, estimates recovery, and explores assumption-based economics — built from 124,302 public Colorado well records, 15.8 million monthly production reports, and 21,034 scored Texas wells across three basins. No proprietary data, no subscription.
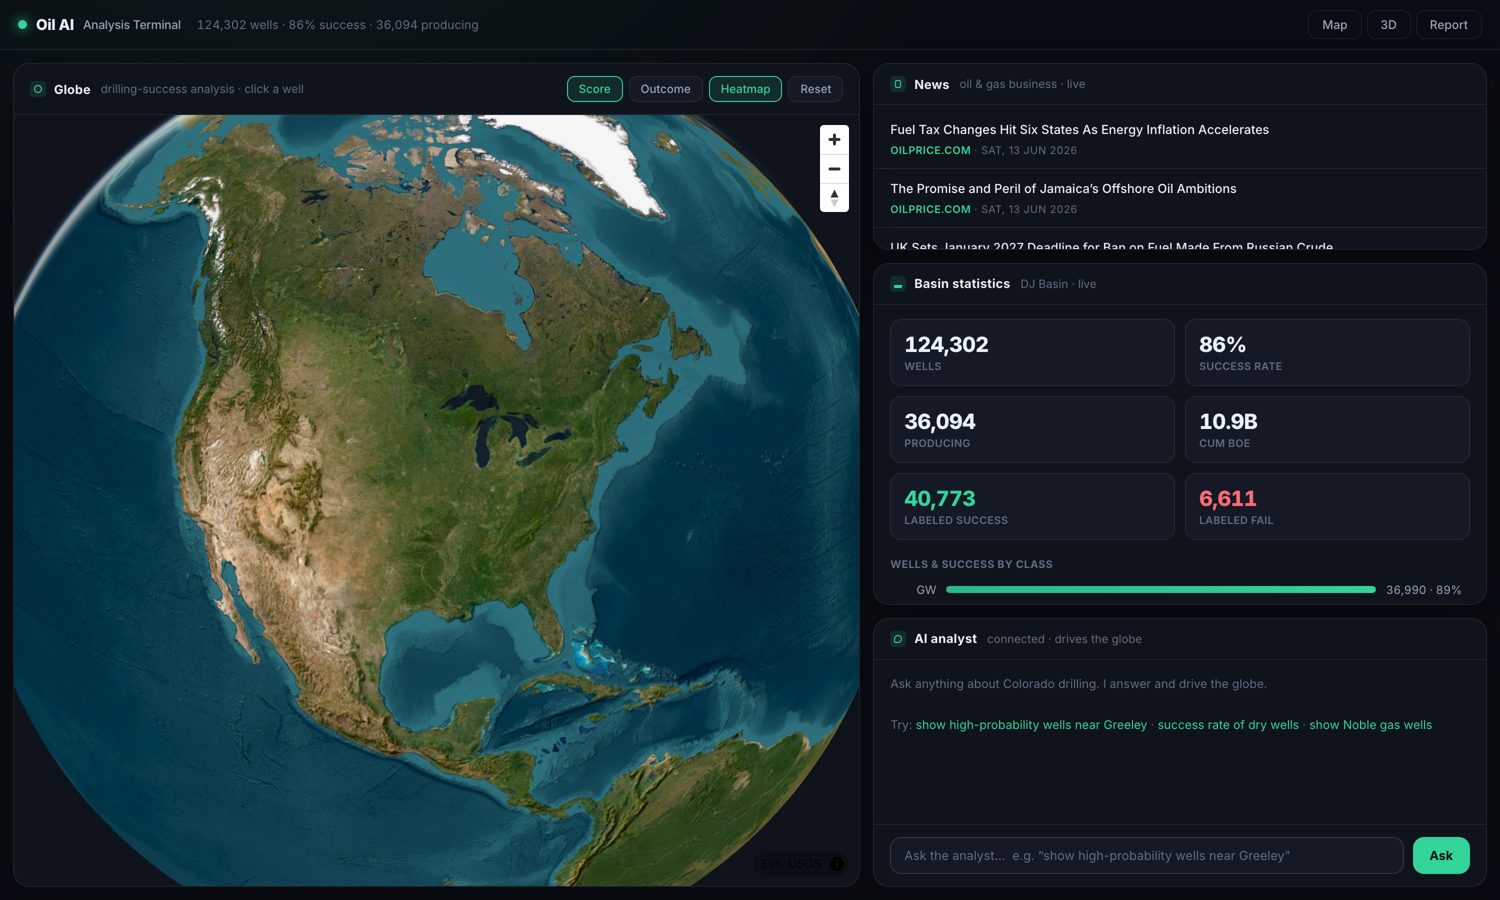
Scroll through the same workflow an analyst follows: orient, screen, inspect, and test assumptions. Every view stays tied to the same public-data model.
Spin from the global view into Colorado, then hold geographic context while the model narrows toward the DJ Basin.
124,302 wells indexedThe surface shows historical model scores, support, and uncertainty. It is not a validated probability for a future well.
Historical screening surface activeMove below the flat map. Extruded cells expose production concentration, aggregate EUR, and historical screening score without losing location.
Subsurface context resolvedUse observed production from an indexed well to test retrospective NPV, IRR, breakeven, and payback under your assumptions.
Sensitivity metrics readyNot "powerful" or "seamless" — concretely: a historical screen, observed production, retrospective value, and a plain-English explanation.
For an indexed well or supported grid cell, Oil AI reports a score for the defined production threshold. Calibration is measured in historical spatial out-of-fold cohorts; prospective performance is not yet established.
Arps decline fits describe indexed wells with production history; experimental location estimates remain screening inputs, not reserves.
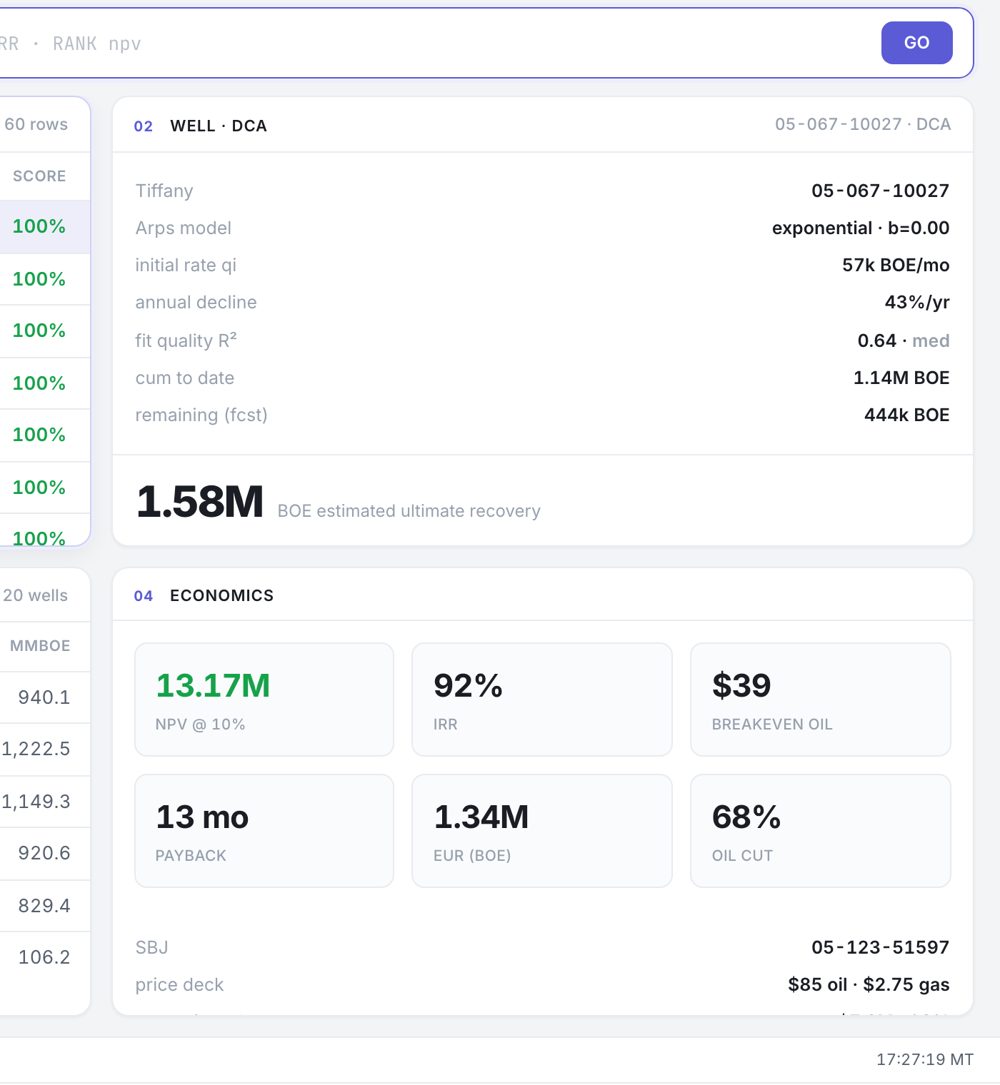
For an indexed well with observed production, test NPV, IRR, breakeven oil price, and payback at a price deck you set.
Ask in plain English — "show high historical screening scores near Greeley", "success rate of dry holes" — and the AI can answer and move the globe to relevant results. It is read-only and guarded; verify the evidence it returns.
Live-API features — the analyst, Decision Lab comparisons, and the FRED price feed — run on API deployments. The public static demo serves no API routes, so those panels fall back to the published evidence files instead of failing.
Most "AI well models" score brilliantly because they cheat — random train/test splits leak a well's neighbors into both sides. Oil AI is engineered against that.
124k Colorado ECMC well records + 15.8M production reports + Texas Railroad Commission wells, leases, and permits + FracFocus, normalized into one reproducible warehouse.
Whole 15 km blocks are held out, then a stricter 3 km guard ring removes adjacent training wells. The model retains AUC 0.801 vs 0.732 kNN.
A point-in-time kNN drilling-density model sets the DJ Basin historical spatial-CV bar at AUC 0.753. LightGBM clears it at 0.842 after post-outcome features are removed. Each Texas dataset gets its own baseline the same way.
Colorado's next-year rolling AUC is 0.622 vs 0.675 kNN, so that promotion stays blocked. Scores are presented as contemporaneous screening, with geographic support and uncertainty exposed.
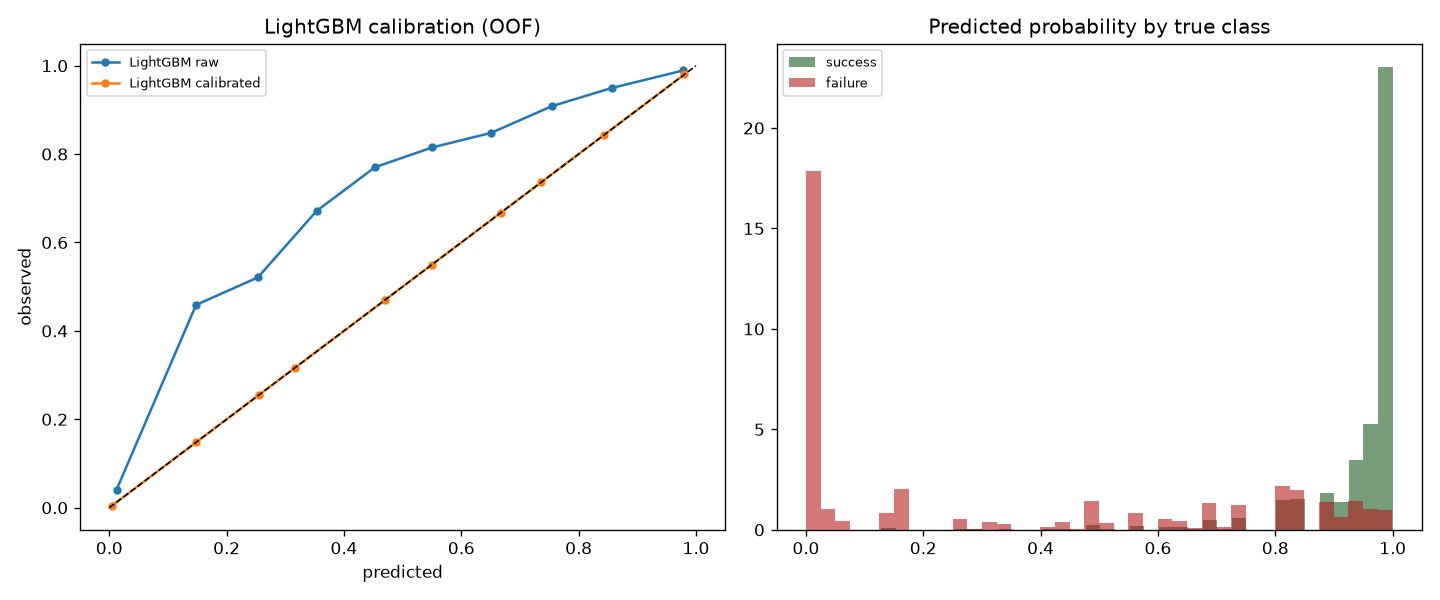
No dataset speaks for another. Each basin gets its own labels, its own model, and its own point-in-time drilling-density baseline to beat. Every figure here is historical spatial-block cross-validation — a screening result, not a validated future-well probability.
AUC 0.842 against a 0.753 density baseline (+0.088). Next-year rolling ranking still trails that baseline, 0.622 vs 0.675, so promotion stays blocked.
AUC 0.875 against 0.745 (+0.130); cutoff-2020 forward split 0.841 vs 0.789. Only La Salle shows a statistically resolved forward edge; Karnes and De Witt are consistent with zero lift over density at these sample sizes.
AUC 0.8948 against 0.7328 (+0.162) — the largest historical lift here — and it holds under a forward split at 0.800 vs 0.637.
AUC 0.897 against 0.764 (+0.133); forward 0.836 vs 0.739 in a test window whose base rate is 0.877 — that caveat travels with the number. Multi-well-lease oil is excluded by design: Texas reports oil by lease, and the allocation error runs 50–91%.
All four are back-tests over already-drilled wells. Operators chose those locations with information the models do not have, so a historical lift over drilling density is evidence of skill in screening — not a forward guarantee. See every model, baseline, and forward test →
Four models, one warehouse — four views, each suited to a different question.
The full workbench: an interactive globe, live oil & gas news, basin statistics, and a connected AI analyst that drives the view.
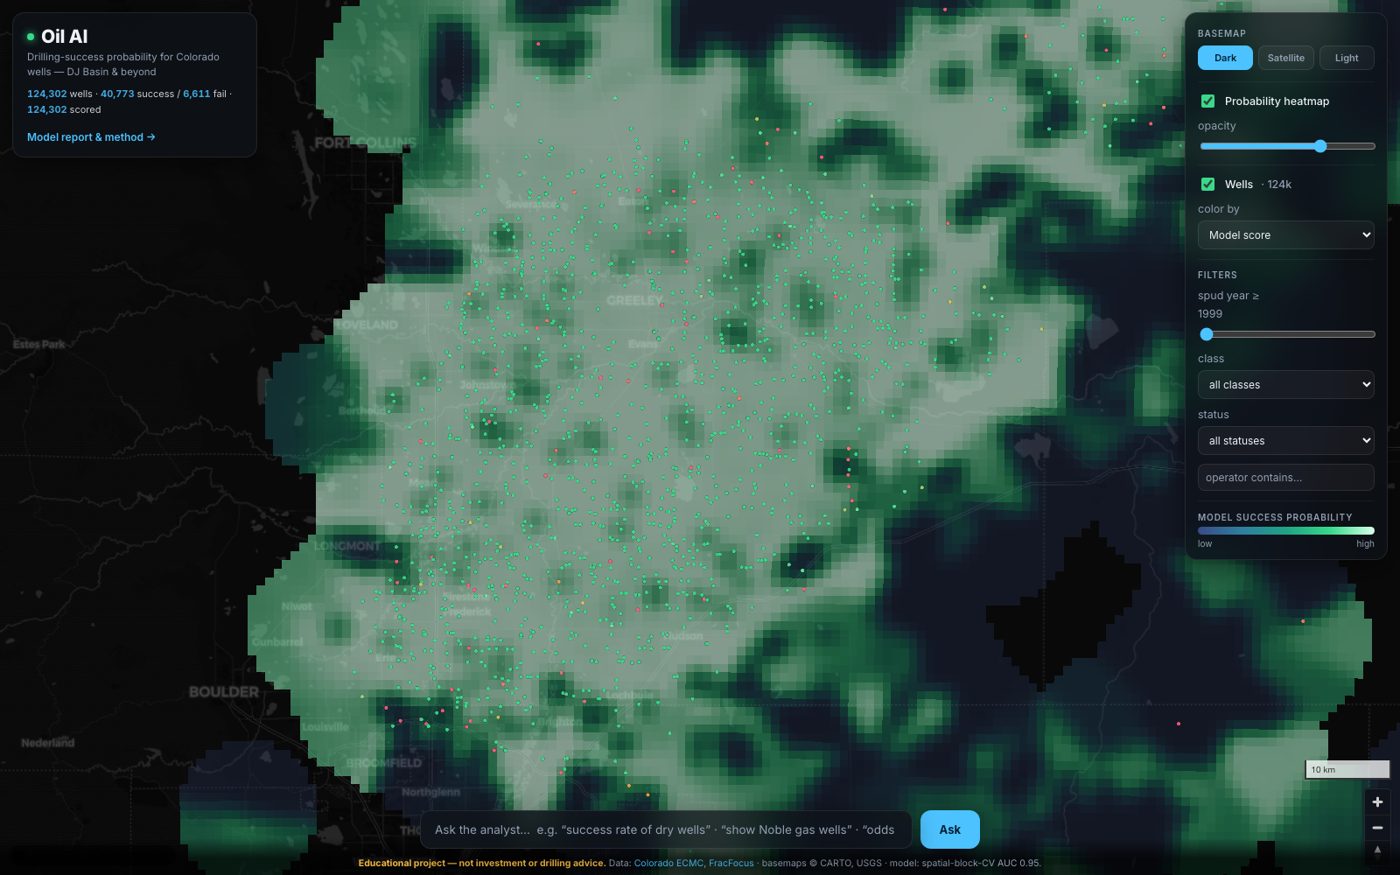
124k wells + the historical screening surface on satellite imagery.
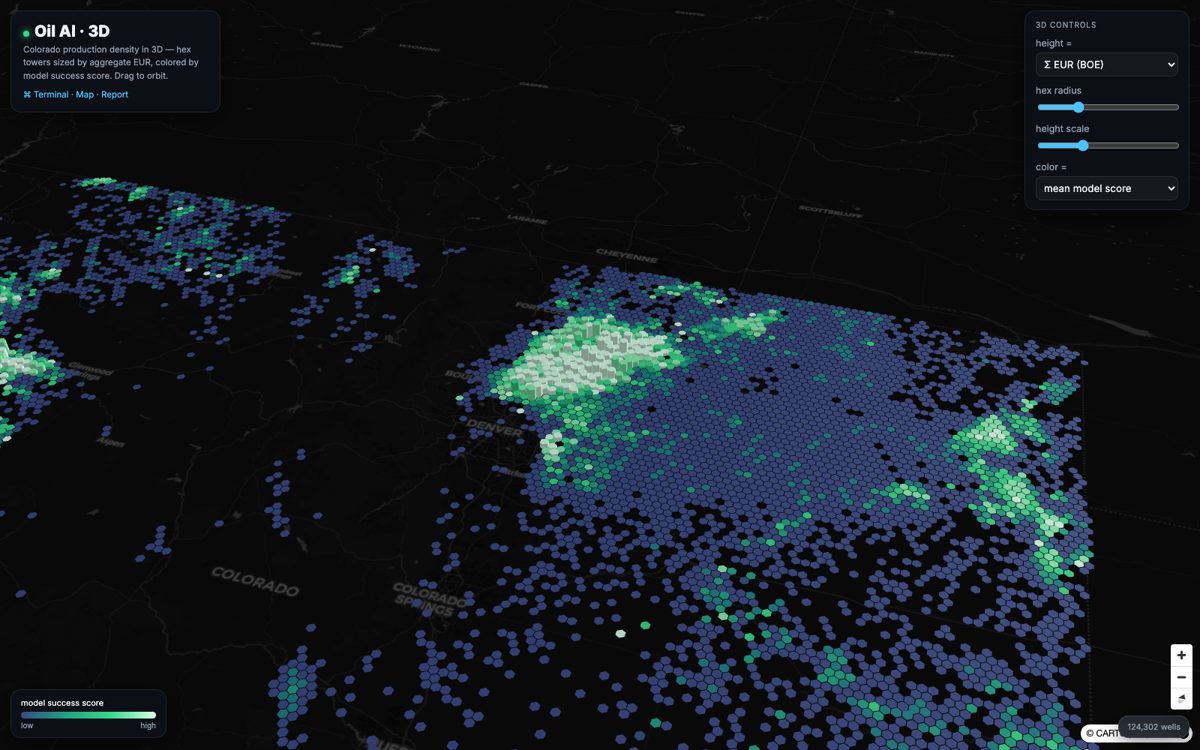
Production density as 3D towers, sized by aggregate EUR and colored by historical screening score.
The full writeup — label, validation, model-vs-baseline, calibration, and limitations.
An educational project — not investment or drilling advice. Oil AI is built entirely on public data (Colorado ECMC, Texas Railroad Commission, FracFocus, FRED, USGS, Tilezen) to demonstrate an honest data-engineering, ML, geospatial, and agents pipeline. It historically screens a coarse production threshold; it does not provide a validated future-well probability or economics you should act on.
Open the terminal, spin the globe to Colorado, and ask it a question.